Over the years far too many items catch my eye and have gone into the “one day/some day/maybe/perhaps”. Capturing them in Org mode was a major advance, at least then I had a record, but working through them is still a weak point. Some of them predate my use of Org mode, coming from bookmarks accumulated in del.icio.us, feedly, pinboard and manual links from prehistoric times.
Particularly problematic is an ever-growing (virtual) pile of PDF files, text files, EPUB books and bookmarked links, together with a fire-hose of RSS feeds. The latter is causing me some grief at the moment; the combination of org-feed pulling in feeds I’m interested, FOMO preventing me from being ruthless and culling them, and the website configuration of some sites causing org-feed to add a complete new copy of the last n sites every time it is run has conspired to cause my rss-org.org file to exceed 10MB – 105000 lines of text and 7690 items!
To try and get my head around what was piled up in the background I wrote a few snippets of shell, then decided to run them daily and graph the results. First up was the incoming bookmarks in notes.org, mostly captured from websites that have popped up during daily browsing. For some years I’d been using a capture template that pulled in items into the file as below:
* 2017
** 2017-08 August
*** 2017-08-02 Wednesday
**** [[http://sketchnotearmy.com/sa_books/][Books - A Showcase of Sketchnotes]]
    :PROPERTIES:
    :DateCreated: <2017-08-02 Wed 18:10>
    :KEYWORDS: sketchnote
    :ID:       015b9f93-fadf-44e7-ae47-039715724cc6
    :END:
     Source: [2017-08-02 Wed]
Then a grep "^\*"|wc -l give me a very quick and dirty count of items.
As soon as I had the current numbers I started kicking myself, wanting the historic values, so I reprocessed my git history:
for m in `seq 7`; do
  for d in `seq -w 28`; do
    (echo 2017-0${m}-${d};
      git show HEAD@{2017-0${m}-${d}}:notes.org |\
      grep "^\*\+ ${n}" |wc -l)\
      |paste -d "," - - | tee -a stats.csv
      done;
  done
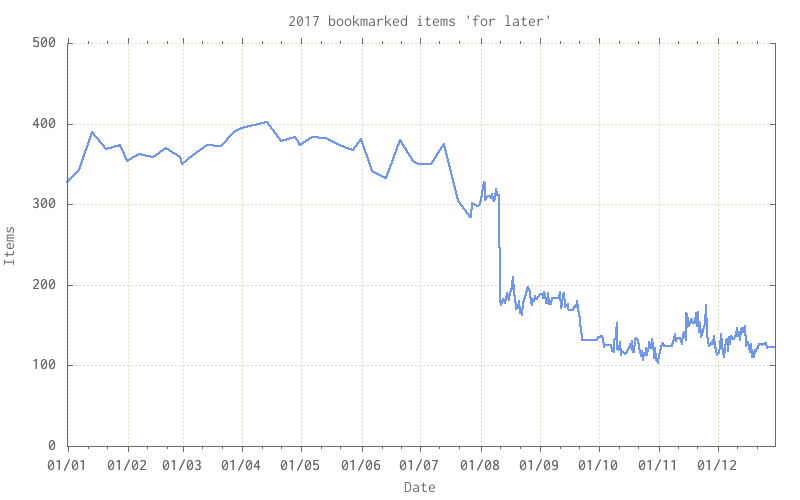
Followed by a quick gnuplot template and I’ve got a graph of how high the pile of unread bookmarks is:

I put this into the daily cron job and let it run for a few days, then decided that I didn’t like having the year, month and day headings being counted so I’ve changed the capture template to add captured items as a “MAYBE” rather than a bare note, and a quick edit of the existing notes.org file to convert the existing bookmarks to MAYBE got me the sudden drop.
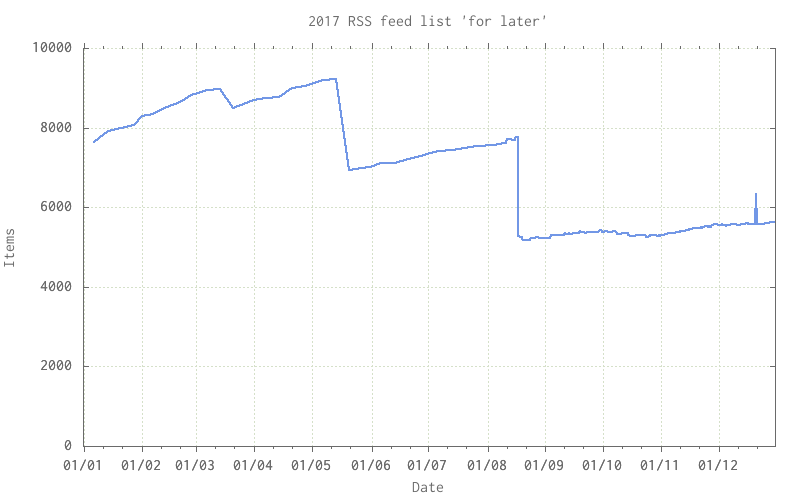
Some similar greps and and graphs and there’s a graph of the items waiting from my RSS feeds – clearly revealing that I’ve got a deal of housekeeping here.

As stated above, the RSS list has grown enormous and contains a mass of duplicated items. The drop from around 9000 to 7000 in mid-May was when I found that a previously behaving podcast feed had taken to republishing, daily, that the last 100 items were all “new” and fooled org-feed-update into adding each item again and again. More sorting and culling is required, when I get around to that there’ll be some similar drops in the item counts.
From there I decided to take a look at the breakdown of all tasks in all my org files; TODO, MAYBE, WAITING, STARTED… DONE. A slightly more complex bit of shell, grepping for "^\*\+ ${n}" where n is the keyword, piped out through wc(1) and munged into a CSV file. The numbers looked OK again I reprocessed my git history to find what it had looked like for the year to date.
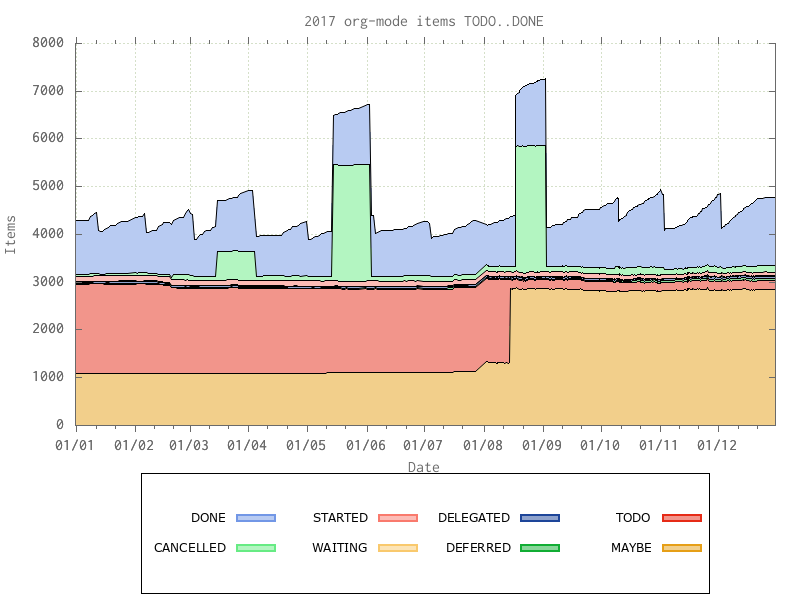
To generate the graph took a few minutes of searching once I knew what I wanted and the correct terminology – stacked graph – to use. Courtesy of https://newspaint.wordpress.com/2013/09/11/creating-a-filled-stack-graph-in-gnuplot/ I now have a nice graph showing the stack of my TODO/MAYBE/STARTED..DONE tasks. et voila, we have:

The overall sawtooth shape is caused by me archiving off all completed work at the start of each month, the very large number of items in TODO and MAYBE is due to the presence of a number of extensive lists of items – eg a blog’s worth of articles turned into TODO items, or a list of someone’s “100 favourite books” – all present as low priority reading if I find sufficient time and interest.
In summary, I certainly found that visualising the changes in my captures, my RSS feeds and the state of my overall Org mode life through the year so far has given me some insight in how I’m using the tools.
Updates
- : while removing vast numbers of duplicate entries in one of my RSS feeds I discovered that the overall graph hadn’t included the CANCELLED items so I added it to the statistics script and graph template, then reprocessed my git history to extract it as well. Two huge blocks of CANCELLED items show where I did some manual cleaning on the
rss-org.org. - : I’ve collecting the same stats and generating the graphs into 2018, today I decided to to show them off.

