Following on from and the post in 2017, I’m still generating graphs from my Org mode notes for 2019. Here’s this year:
Bookmarks
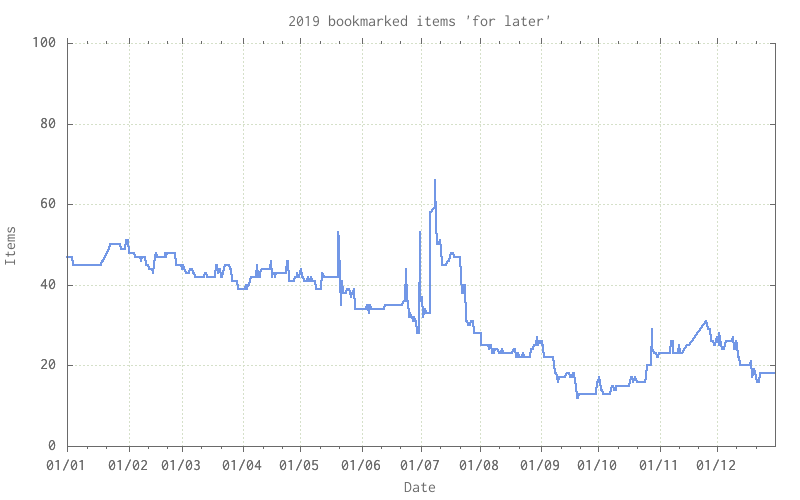
The pile of unread bookmarks:

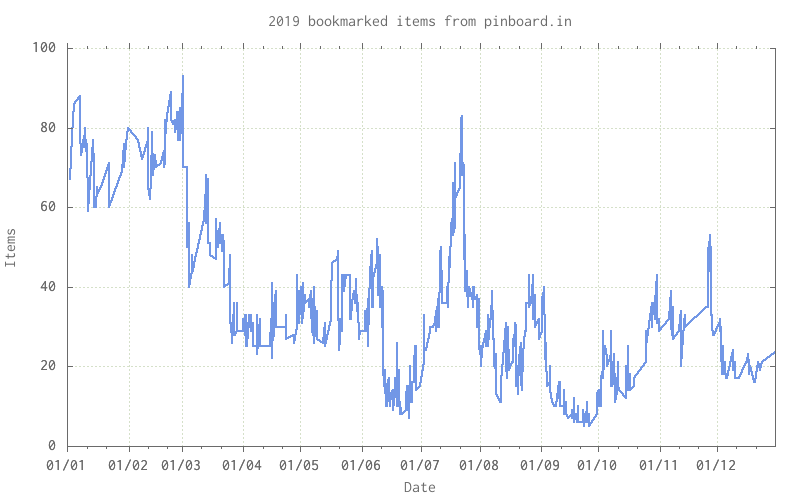
Still stubbornly hovering around 50, there’s a number of items that I must get through some time when I’ve got time and inclination. A change in workflow as I now use pinboard.in for most of my quick bookmarks means that all that I’ve got left in the graph above are the old items.

RSS feeds
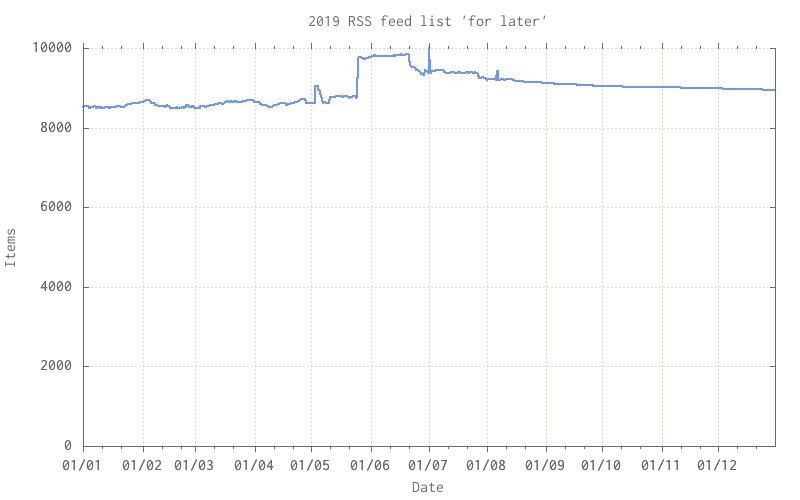
The firehose of RSS entries:

I’m not sure if something’s gotta give. Some of the blogs I dip into for a while and then ignore, too much accumulates when I’m not reading.
Overall status for the year
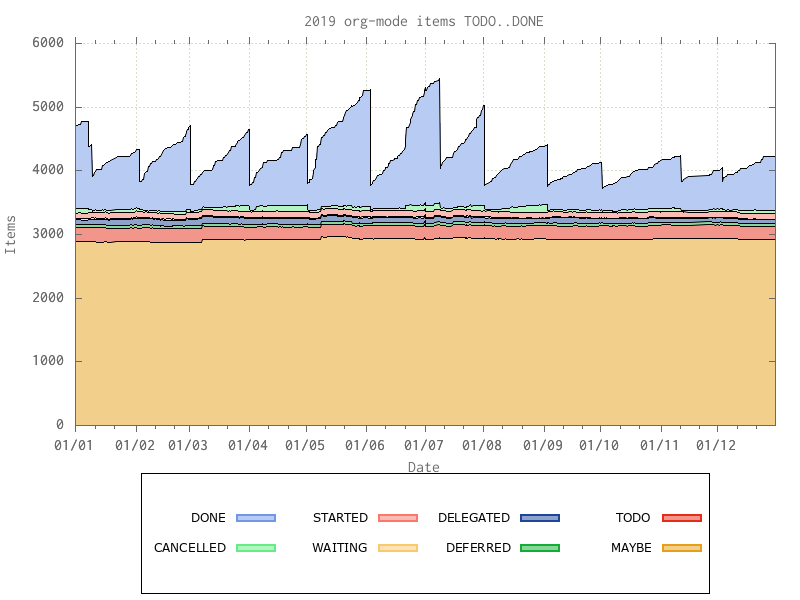
The overall graph of what I’ve got TODO, as well as all the MAYBEs, STARTEDs, DONEs, etc:

Repeated from years gone by; The overall sawtooth shape is caused by me archiving off all completed work at the start of each month, the very large number of items in TODO and MAYBE is due to the presence of a number of extensive lists of items – eg a blog’s worth of articles turned into TODO items, or a list of someone’s “100 favourite books” – all present as low priority reading if I find sufficient time and interest.

